Tracking Spectator Influence on Sports Wagering Across Arenas and Grounds
Written by Parker Russell · Jul 23, 2026
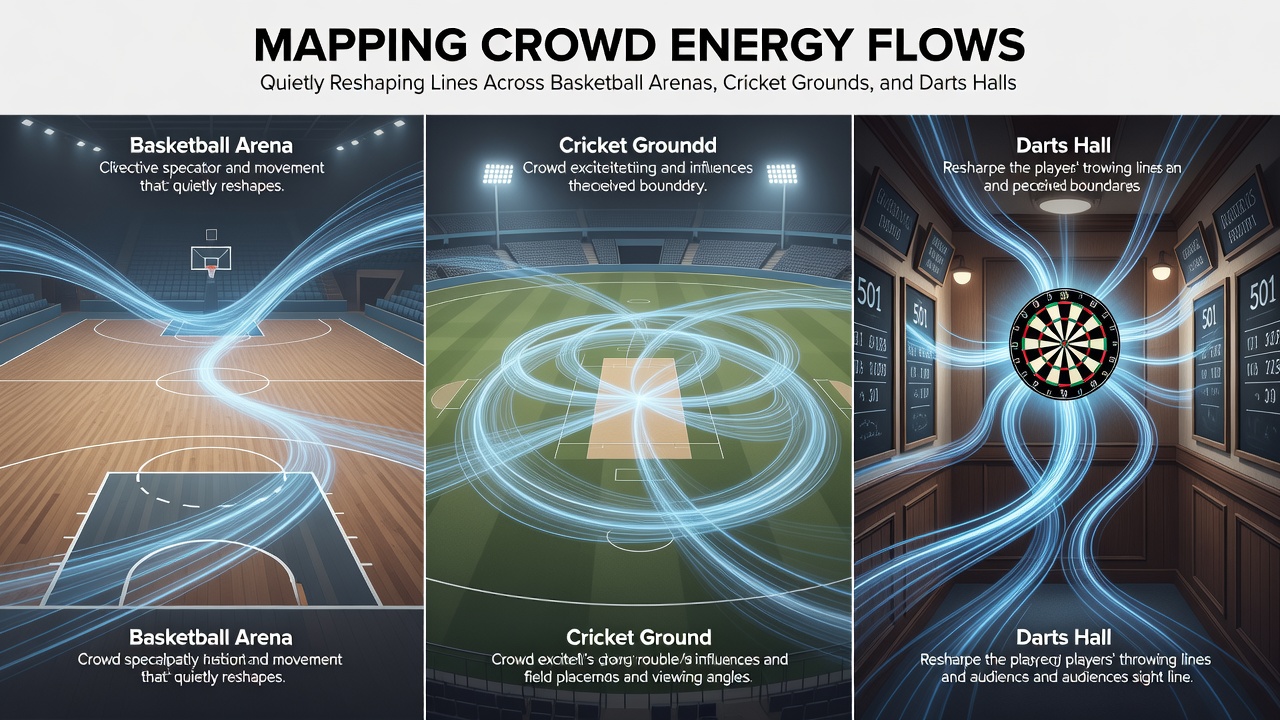
Tracking Spectator Influence on Sports Wagering Across Arenas and Grounds
Data from venue monitoring systems shows that crowd density and noise levels correlate with shifts in live betting lines during basketball games, cricket matches, and darts tournaments, with operators adjusting spreads and totals in response to real-time performance variations. Researchers at institutions like the Australian Institute of Sport have documented how sustained spectator noise exceeds 85 decibels in enclosed spaces and disrupts visiting team communication patterns, leading to measurable drops in shooting accuracy and decision-making speed.
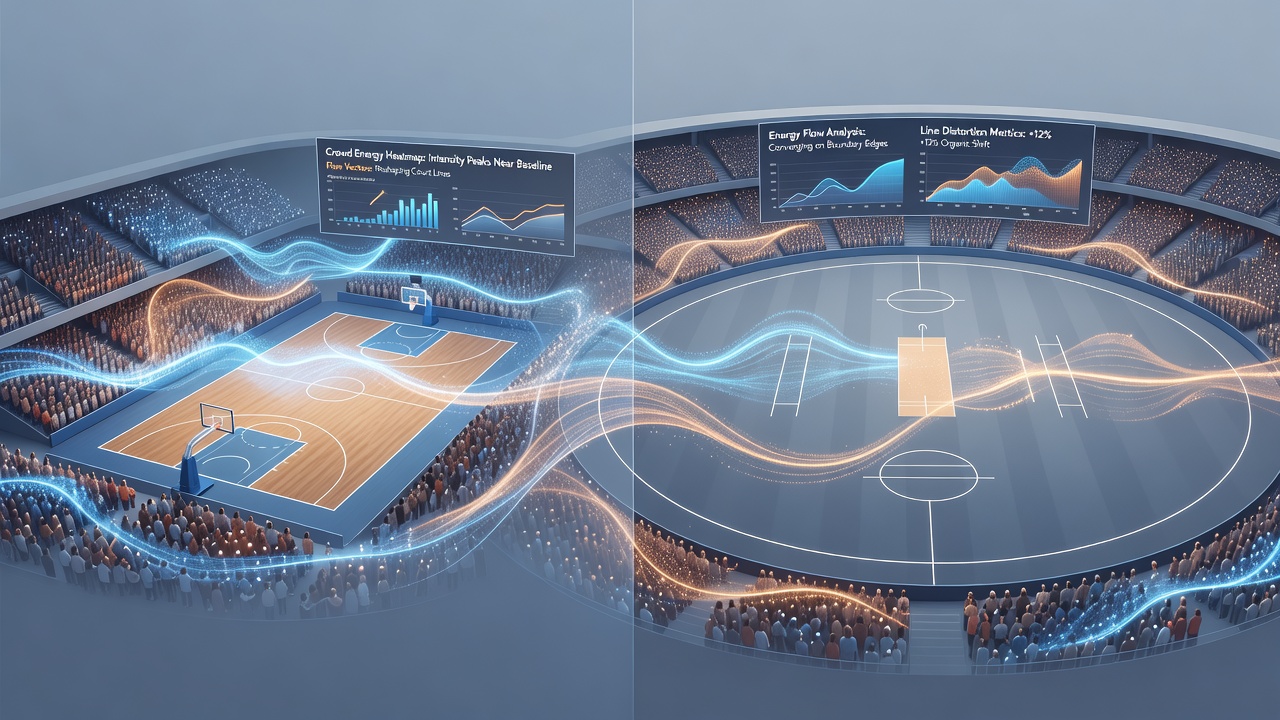
Operators track these patterns through integrated sensors that measure acoustic pressure alongside player tracking data, allowing them to update odds within seconds of noticeable momentum changes. In basketball arenas across the US and Europe, studies indicate home teams convert free throws at rates 3 to 5 percent higher when crowd volume peaks during critical possessions, prompting bookmakers to tighten spreads accordingly.
Patterns in Basketball Arenas
Basketball venues generate concentrated sound waves that bounce off hard surfaces and create sustained pressure zones near the court, according to acoustic mapping conducted during professional league seasons. Teams playing away from home record higher turnover rates in the final quarter when crowd intensity builds, with data from the 2025-2026 campaigns revealing consistent correlations between decibel spikes above 95 and defensive lapses. Betting platforms respond by moving lines on player props such as assists and rebounds, reflecting these venue-specific dynamics rather than relying solely on historical averages.
One analysis of games in major indoor facilities found that energy flows from sections closest to the benches influence substitution patterns, as coaches adjust strategies to counter the audible environment. This adjustment occurs most visibly during back-to-back road games where cumulative fatigue combines with crowd pressure.
Effects Across Cricket Grounds
Cricket stadiums present different energy mapping challenges because open-air layouts allow sound to disperse unevenly, with wind direction and stand design altering how noise reaches the playing surface. Data collected during international series in 2026 shows that home batting sides maintain higher strike rates when large sections of supporters create rhythmic chanting that coincides with bowler run-ups. Operators monitoring these conditions adjust over-under totals on total runs and wicket counts, incorporating venue acoustics into their models alongside weather variables.
Figures from ground sensor networks indicate that crowd surges during key overs correlate with increased error rates among fielders positioned near the boundary ropes. In July 2026 events, several test matches demonstrated line movements of 0.5 to 1.0 runs per over following documented spikes in spectator engagement during afternoon sessions.
Darts Hall Dynamics
Smaller darts venues concentrate energy in compact spaces where audience reactions travel directly to players on stage, producing immediate feedback loops that affect checkout percentages and leg durations. Research compiled by European sports performance groups reveals that vocal support from sections near the oche can extend average visit times by fractions of a second, enough to shift live odds on leg winners and total legs played. Bookmakers integrate audio feeds into their algorithms to detect these micro-shifts before they appear in scoring data alone.
During major tournaments held in compact halls, operators have recorded line adjustments of 0.2 to 0.4 legs occurring within thirty seconds of crowd volume increases, particularly when underdogs mount comebacks. These changes reflect aggregated performance data rather than isolated incidents, with multiple matches across the 2026 calendar showing repeatable patterns tied to seating proximity and chant synchronization.
Data Integration and Line Adjustments
Modern betting systems combine crowd flow metrics with traditional inputs such as injury reports and historical trends, creating layered models that update continuously. Industry reports from Canadian gaming associations highlight how operators in regulated markets use anonymized venue data to refine risk management during high-attendance periods. This approach allows for more precise pricing on props that respond quickly to environmental factors like sustained noise or visible supporter movement.
Analysts note that venues with retractable roofs or variable seating configurations introduce additional variables, requiring frequent recalibration of acoustic thresholds. In practice, these recalibrations produce line movements that align with observed performance dips rather than anticipated outcomes based on team rankings alone.
Conclusion
Mapping crowd energy flows provides operators and analysts with an additional layer of information that influences live lines in basketball, cricket, and darts. Sensor networks, acoustic measurements, and performance correlations continue to inform adjustments throughout events, with data from July 2026 demonstrating consistent application across multiple venues and competition formats. These practices reflect ongoing integration of environmental monitoring into wagering frameworks rather than reliance on static models.