Fixture Gaps and Performance Shifts: How Rest Periods Reshape Success Rates in Successive Athletic Contests
Written by Parker Russell · Jul 28, 2026
Fixture Gaps and Performance Shifts: How Rest Periods Reshape Success Rates in Successive Athletic Contests
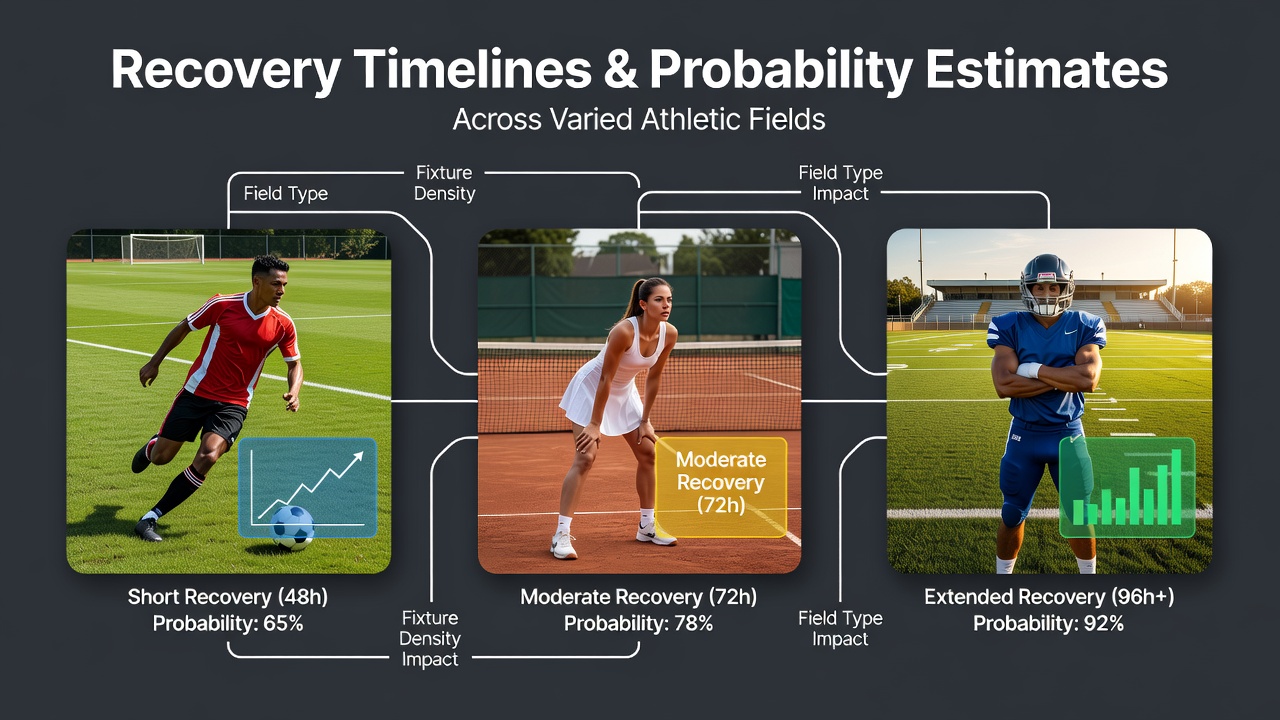
Recovery timelines between fixtures directly influence player output and team results across sports that feature packed schedules. Data from multiple leagues shows shorter gaps often correlate with measurable drops in sprint speed, passing accuracy, and defensive positioning while longer intervals tend to stabilize those metrics. Observers note these patterns appear consistently in soccer, basketball, rugby, and tennis, where successive matches test how well squads manage accumulated fatigue. Studies tracking heart rate variability and muscle soreness indicate that athletes require at least 72 hours for partial neuromuscular recovery after high-intensity efforts. When that window shrinks to 48 hours or less, performance metrics decline by 5 to 12 percent according to aggregated match data. Those reductions alter expected outcome probabilities because bookmakers adjust lines to reflect the higher likelihood of errors or reduced scoring output.Patterns Across Different Playing Surfaces
Grass, hardwood, clay, and artificial turf each impose distinct physical demands that interact with recovery needs. Soccer players moving from natural grass to artificial pitches report increased impact forces on joints, which compounds when fixtures occur close together. Basketball athletes experience similar effects on hardwood after travel-heavy schedules, while tennis competitors on clay face prolonged rallies that elevate lactate levels and extend required rest. Researchers at the University of South Australia documented these surface-specific fatigue markers through wearable sensor data collected during domestic and international seasons.
One analysis of rugby fixtures found that teams playing on consecutive weekends across varying field conditions showed elevated soft-tissue injury rates when recovery fell below four days. The same dataset revealed that probability estimates for clean-sheet results dropped noticeably in the second match of such pairs. Those shifts occur because defensive structures rely on coordinated movement patterns that degrade faster under incomplete recovery.
Data Trends in Successive Matches
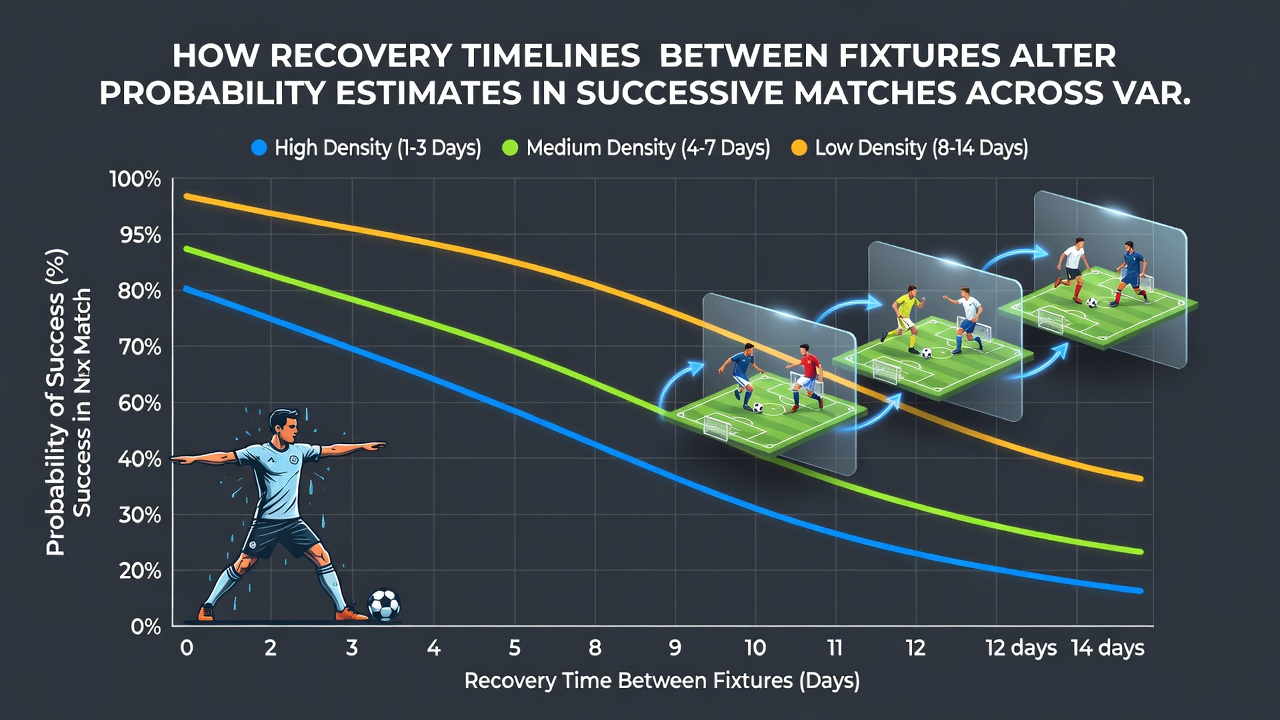
League-wide statistics compiled through 2025 and into July 2026 demonstrate clear trends. In basketball, teams with two days or fewer between games win approximately 7 percent fewer road contests than those with three or more rest days. Soccer competitions with midweek fixtures show comparable adjustments, with away win probabilities declining when squads log under 60 hours between matches. Tennis tournaments that compress schedules into five-day stretches produce higher rates of early-round upsets because players who advance through long matches lack sufficient time to restore glycogen stores and joint mobility.
These figures come from performance databases maintained by national sports institutes and academic groups that aggregate GPS, heart-rate, and video analysis across thousands of fixtures. The patterns hold after controlling for opponent strength and travel distance, suggesting recovery duration functions as an independent variable in outcome modeling.
Modeling Adjustments in Probability Estimates
Analysts incorporate recovery timelines into predictive frameworks by weighting recent match loads against available rest. Models that previously relied primarily on head-to-head records and current form now integrate metrics such as total distance covered in the prior 72 hours and sleep duration tracked via athlete monitoring systems. When these inputs indicate elevated fatigue, the estimated margin of victory narrows or reverses depending on the sport and venue. External research published through the Canadian Sport Institute supports this approach by showing improved forecast accuracy once recovery variables enter the equations.
Coaches respond to these constraints through rotation policies and targeted recovery protocols that include cold-water immersion, compression garments, and individualized nutrition timing. Teams that apply such strategies consistently maintain closer-to-baseline performance levels even with compressed calendars. Data indicates that squads ignoring these measures experience steeper drops in second-match output, which directly feeds into revised probability calculations used by analysts and operators.
Conclusion
Recovery timelines between fixtures serve as measurable inputs that shift performance baselines and therefore alter probability estimates for successive contests. Across grass, hardwood, clay, and turf surfaces, shorter intervals correlate with documented declines in key athletic metrics while adequate rest windows stabilize results. Ongoing data collection through July 2026 and beyond continues to refine these relationships, providing clearer inputs for those who track and forecast outcomes in high-volume athletic calendars.